Best Practices
How is Your Social Media Performing? Use These Easy Reports to Find Out!
Published: Nov 30

Digital marketing has become a significant piece of the pie for a lot of jewelry retailers. For those store owners PPC, SEO, and Social Media are integral parts of their media mix. With all the time and dollars that go into marketing a business online, it’s more important now than ever to understand how those efforts are impacting results.
Whether you’re working with a social media consultant or you are handling everything in-house it’s beneficial to have performance data at your fingertips. Using the standard industry tool, Google Analytics, Punchmark will be touching base on a few reports that can provide easy insight into your social media traffic. So, open up your browser, log in and let’s dive in!
Similar to our prior post, How to Break Down Your Demographic Data in Google Analytics, we have also provided a template that will pull all of the reports mentioned below into one accessible place. This can be found below at the bottom of the page.
Quick Glossary
Before discussing the reports, here are some common definitions:
• Users: A visitor to your site. A user can trigger more than one session.
• Sessions: A session is the period of time a user is actively engaged with your website.
• Pageviews: This is the total number of pages viewed during the sessions on your site.
• Avg. Session Duration: The average length of a session.
• Pages / Session: This is the average number of pages a user viewed during a session.
What Percentage of Total Traffic is Social Media?
In Google Analytics, select the report in the left-hand column, at Acquisition > Overview. You can also type acquisition overview in the search bar.
This report is high-level and allows you to see what percentage of traffic came from which channel. It also shows the number of users, new users, and sessions that came from each individual channel.

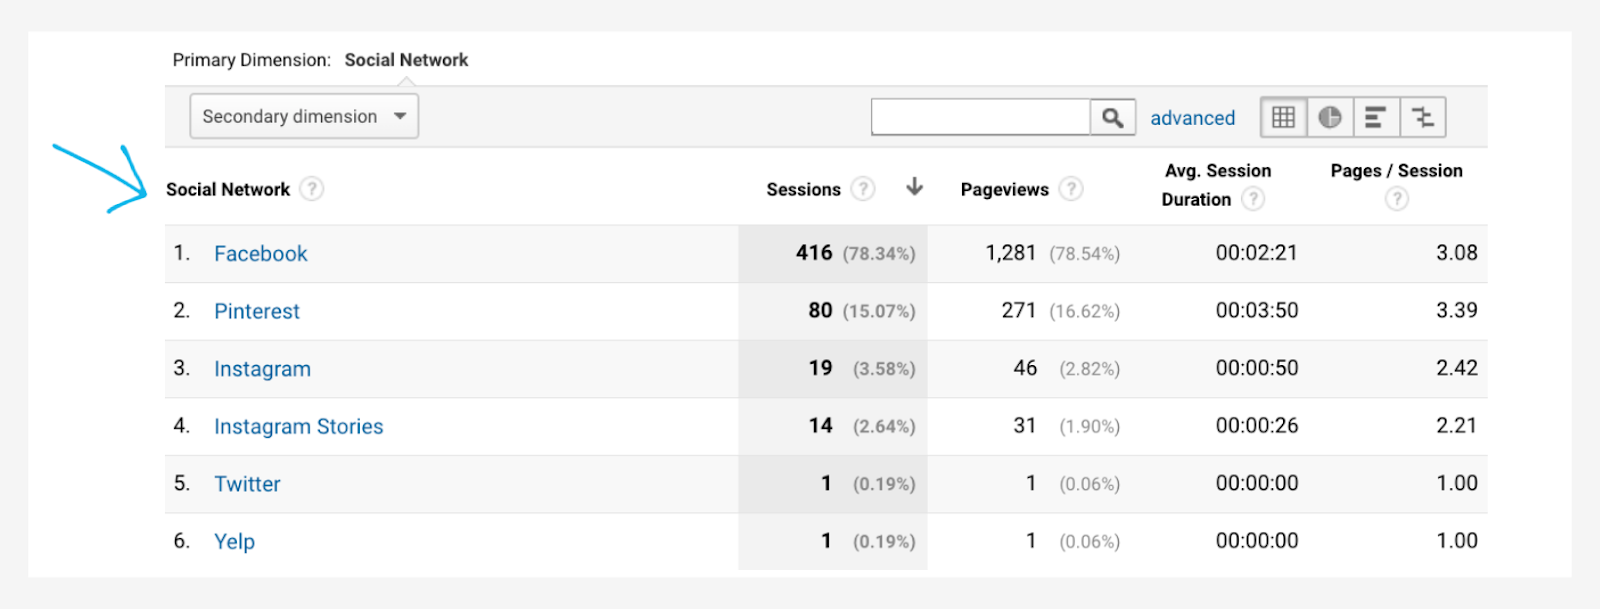
How Much Traffic is Each Social Media Platform Bringing In?
Select the report in the left-hand column, by Acquisition > Social > Network Referrals. You can also type network referrals in the search bar.
The network referral report provides us with a snapshot of how all social media networks are performing. It has a breakdown of each network, the number of sessions that were triggered from each, how many pages were viewed, how long on average a visitor stayed on the site, and how many pages they interacted with.
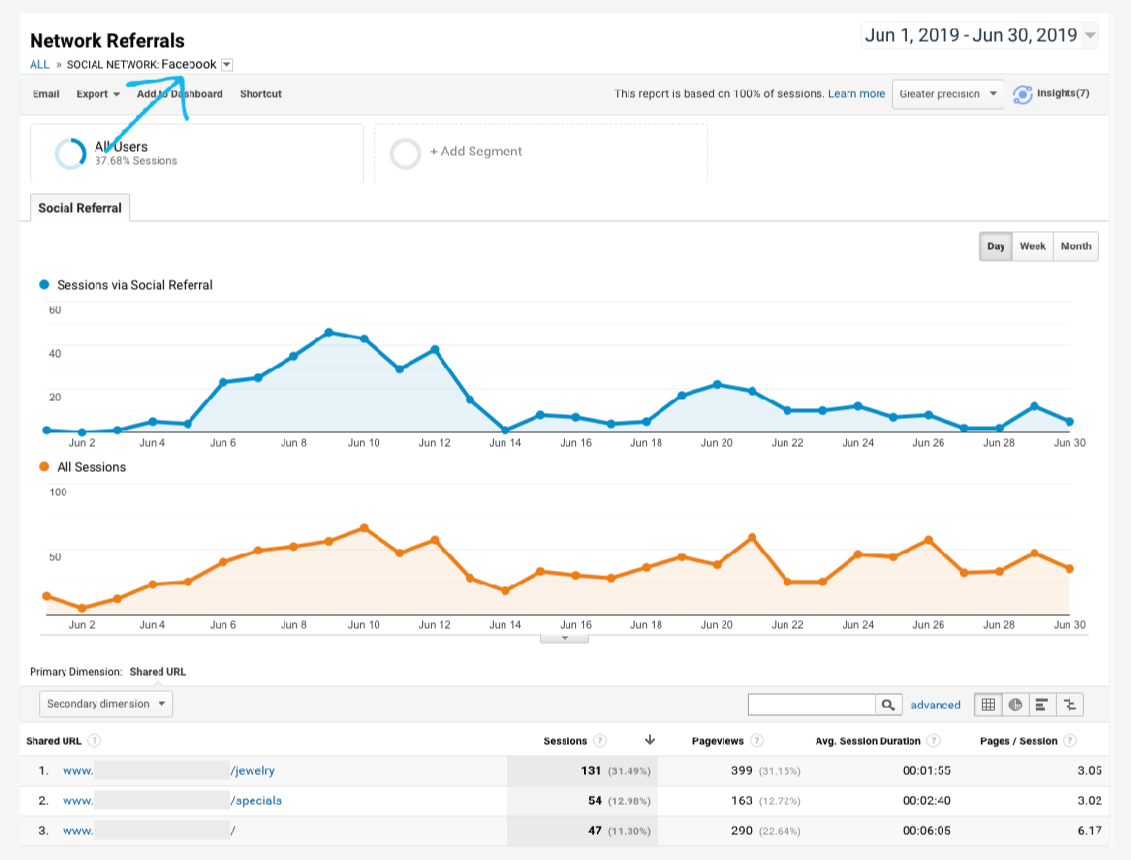
How Has Social Media Performed Over Time & How Many Users Landed on a Particular Page?
To review the performance of each individual social network, in the network referral report, select the source you would like to review. From there you are able to see traffic from that source over the date range you’ve selected. Underneath the traffic graph you will find a list of which pages generated that traffic as well as the associated page metrics.
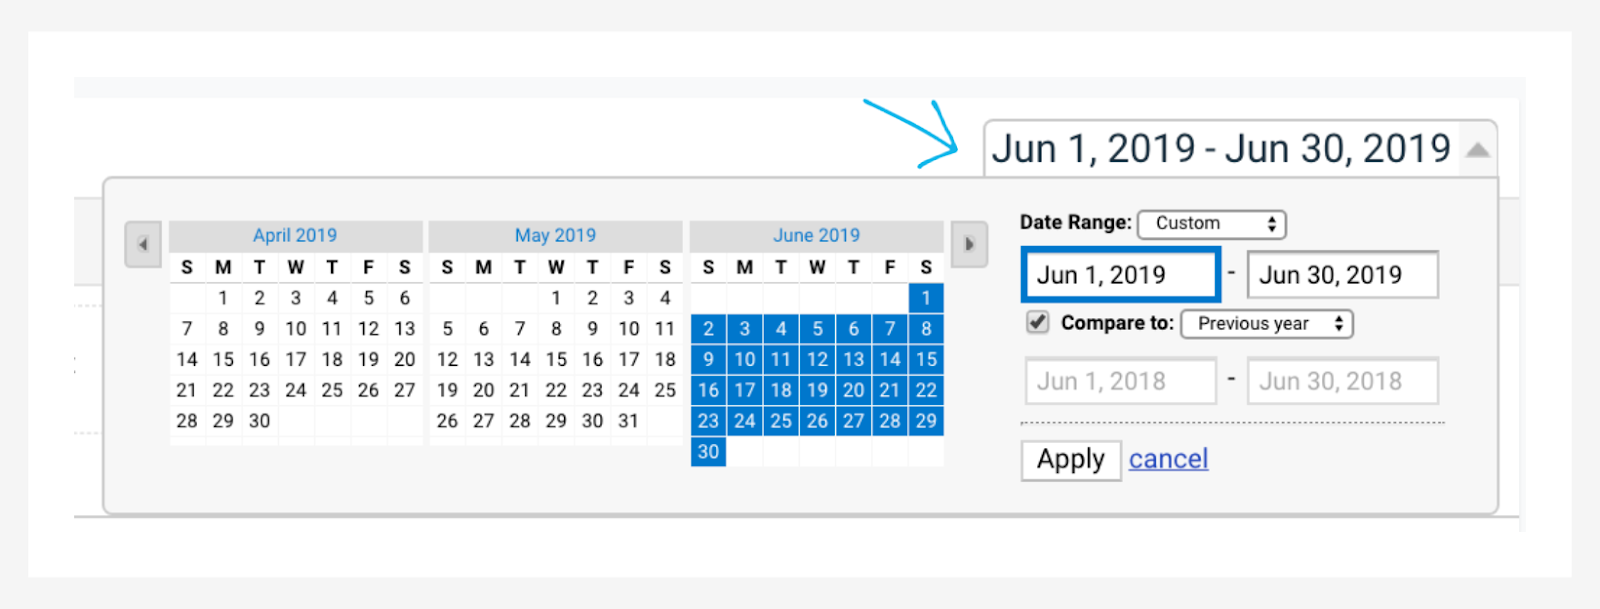
To compare data select the date range in the right-hand corner. Check the ‘compare to’ box. You can compare the previous period, which means comparing the same amount of days your date range is, prior. You could also compare year-over-year data. Or, if you need to look at something more specific, you can select a custom date range.
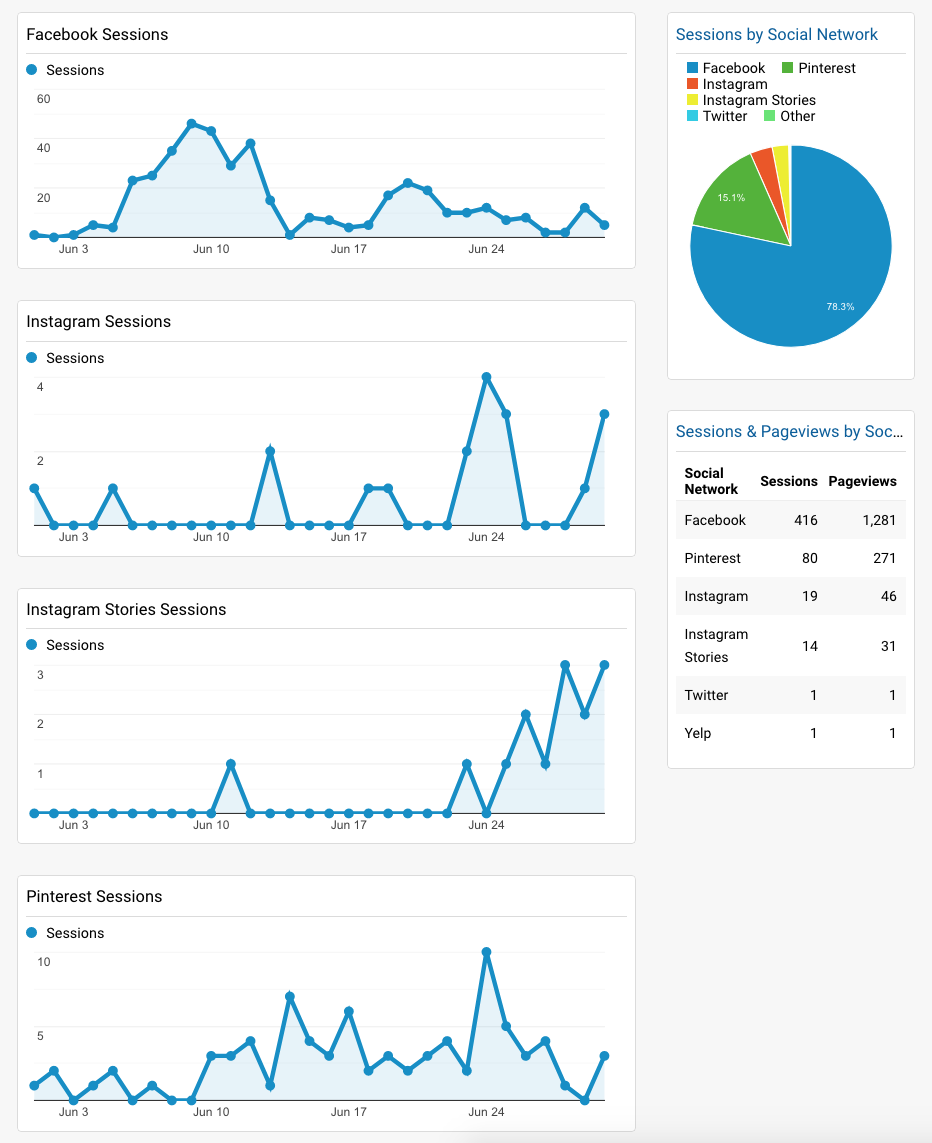
Social Media Dashboard Template
To set up this dashboard, make sure you are logged into the email address attached to your Google Analytics account. Click on the link below and select the Google Analytics account you want to set this up for. It will automatically populate the dashboard for you.
Template Link: https://analytics.google.com/analytics/web/template?uid=-Qvl6sycR_idYpS5cxbC-g
As part of Punchmark's educational webinars, there is also a recorded session discussing these reports more in-depth. This can be accessed in the resources section in V6's SiteManager.
If you have any questions about the above feel free to reach out to Punchmark's Search Engine Marketing Manager, Katie Kinlaw (katie@punchmark.com.)